Brad T.
May 6, 2023
Population Projections by County (US Map)
Below, we’ve put together an interactive US map, with a link to each state’s reporting of population projections. The purpose of this map is to provide any new land-purchasers or prospective buyers with as much due diligence as possible.
For many, population-growth projections in any prospective area play a role in that due diligence process. Click on a state below and find your county’s projections, growths and declines – simply click on a state below.
If viewing in mobile-version: for best results, zooming-in may be required prior to selecting state.
Please note: Some states will provide downloadable PDF, while others simply link directly to county website data.
If you’d like a clearer visual of current population in your area – click HERE to check out our heat map.
Conclusion
We feel this data may be helpful for anyone who’s looking to leave unsafe areas in favor of something more suitable for a better life. Because let’s be honest – large cities aren’t for everyone.
Recent Blogs

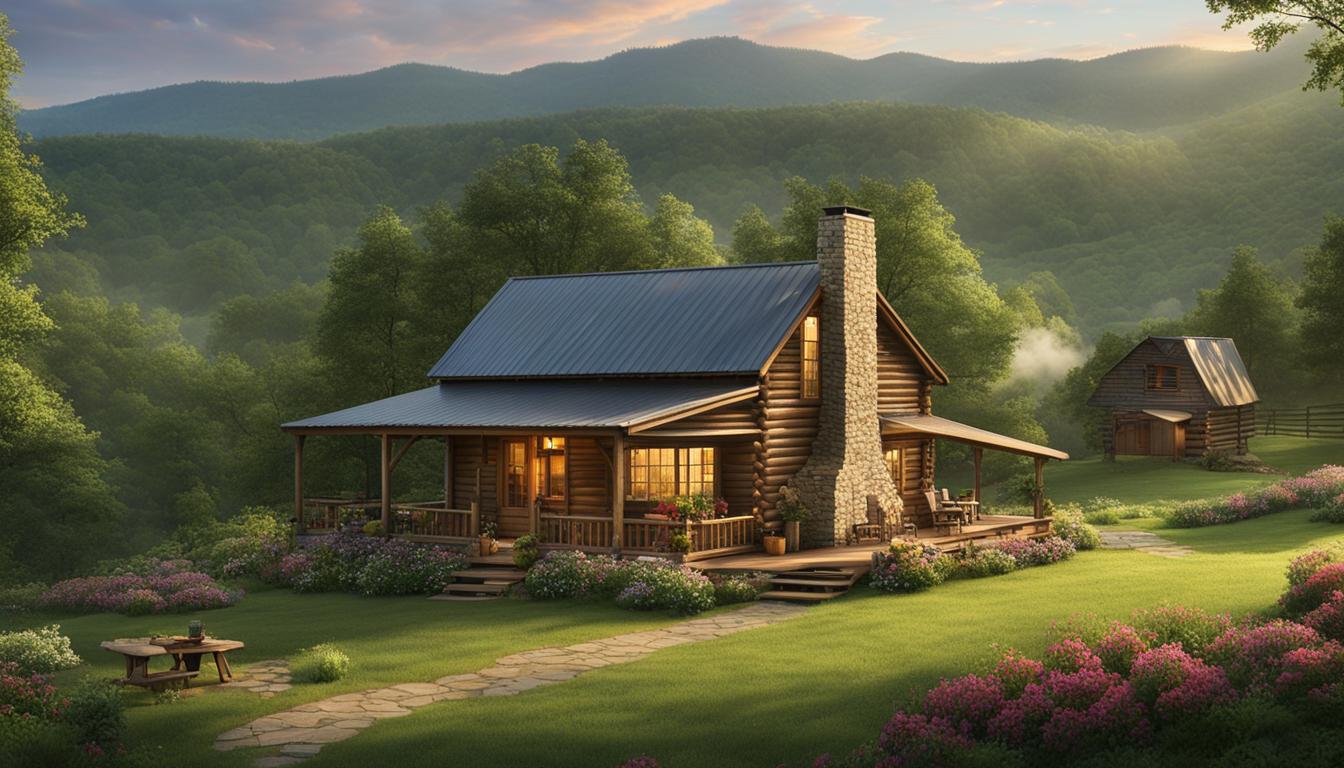
The Joys of Living In Rural Areas: Serene Bliss
Living in rural areas offers a unique and enchanting experience that is unparalleled. The serene bliss of countryside living provides a break from the hustle and bustle

Land Investment: Value Increase Over Time Explained
Welcome to our guide on investing in land and understanding the potential value increase over time. Land can be a lucrative investment opportunity, offering enticing returns and

Benefits of Home Gardening: Why It’s Vital
Welcome to our article on the benefits of home gardening. In today's fast-paced world, where convenience often takes precedence, the act of nurturing and growing plants in
Living in the Appalachians: Insights & Lifestyle
Welcome to the breathtaking region of the Appalachians, where the beauty of the mountains and the warmth of its communities create a unique and enriching living experience.

Why More Americans Choose Rural Life in 2024
Over the past decade, there has been a noticeable trend of Americans moving away from crowded cities and embracing the quiet, serene lifestyle of rural areas. In
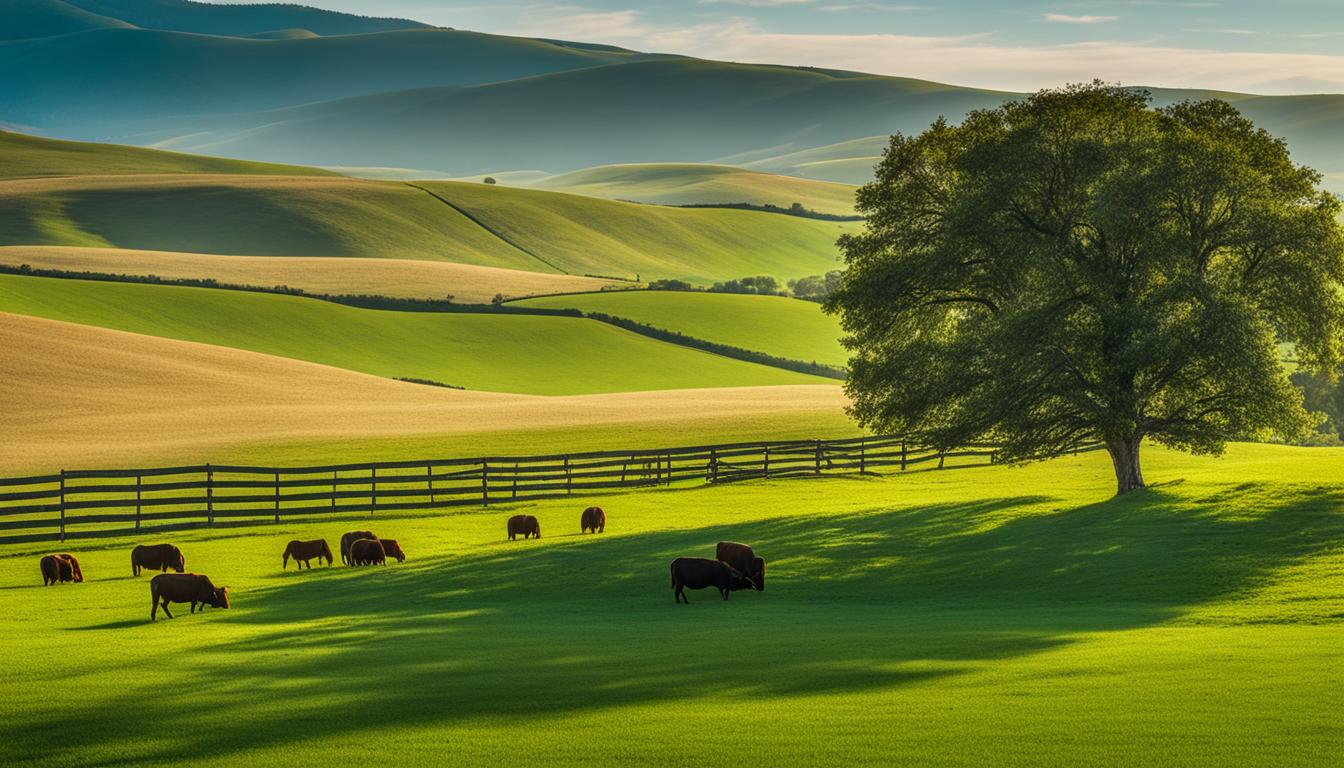
Investing in Rural Land: Essential Tips
Are you considering investing in rural land? Whether you're looking for a peaceful getaway or an opportunity to diversify your investment portfolio, rural land can offer unique
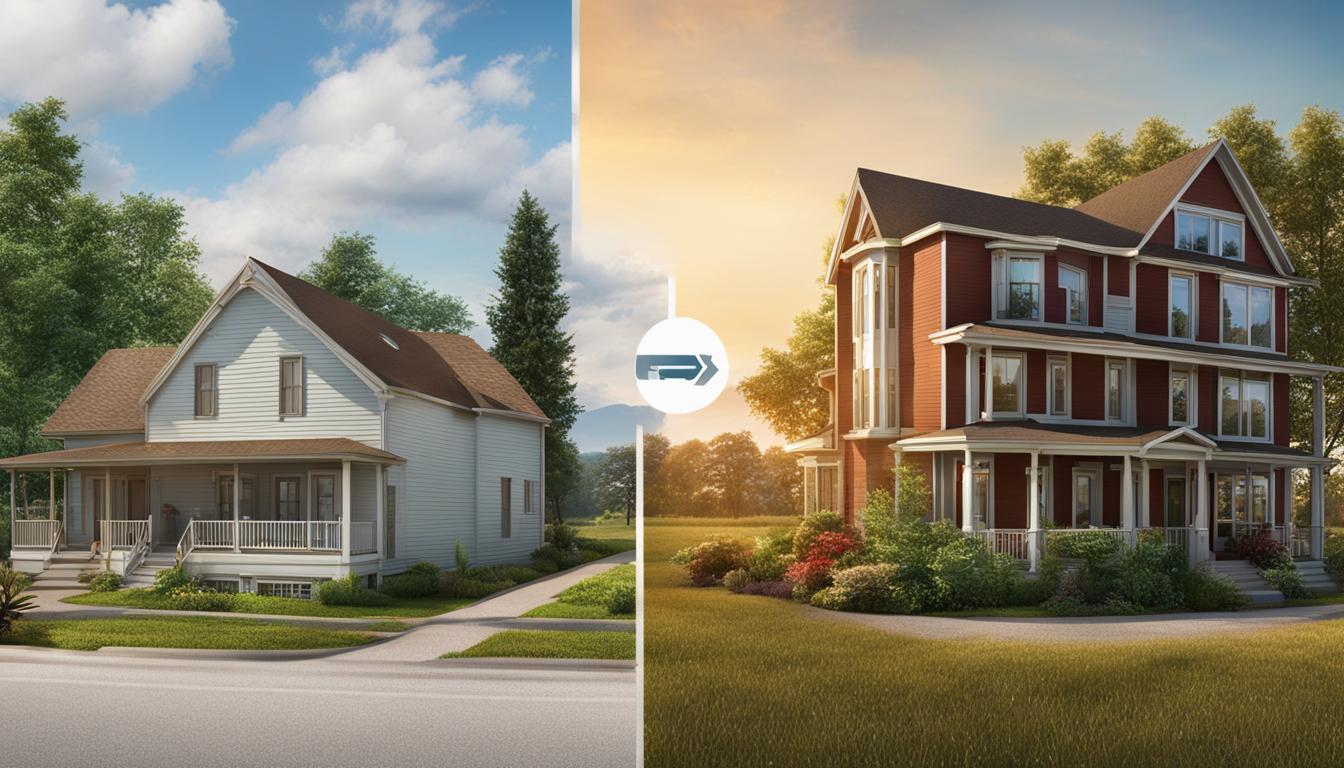
Comparing Affordability: Rural Living vs. City Living
When it comes to choosing a place to live, affordability is often a top consideration. Rural areas can offer a less expensive lifestyle compared to bustling cities,
The Importance of Prepping and Survival Skills – Interviewing David
The Importance of Prepping and Survival Skills: Interviewing David Savage Ever wonder what you'd do in a crisis situation in which
How to Know if a Property is in a Flood Zone
How to Know if a Property Is in a Flood Zone Here, we'll share a really quick way that will allow you to know